Insights+ // The brain behind your operating system

Insights+ turns every interaction across marketing, leasing and community into the data that moves NOI. One source of truth. Real-time signals. The numbers your team acts on — and the numbers your owners trust.

Built for the people who run the portfolio

Property teams and operators. Portfolio and investment managers. Owners and investors. Compliance and risk. All aligned in one place.

Mockup

Property management teams

Run the month in real time, not from a Friday spreadsheet.

  • Marketing and leasing performance with detailed funnel
  • MTD pacing against prior month and portfolio average
  • Community performance and resident satisfaction
  • Resident-experience leaderboards across portfolios
Mockup

Portfolio and asset managers

Defend NOI in real time. Defend valuations with evidence.

  • NOI bridge — budget vs actual, attributed to drivers
  • Void cost waterfall with NOI sensitivity
  • Yield Control with market benchmarking
  • Reversionary potential by scheme
Mockup

Executives, owners, and investors

Win mandates and tell the board the story the data backs up.

  • Portfolio overview — units, value, vacancy, tenancy length
  • Demographic and resident profile pen portraits
  • Twelve months of marketing, leasing and community KPIs
  • Cross-portfolio performance leaderboards
Mockup

Technical, compliance and risk

One source of truth. Every number reproducible. Every change logged.

  • Two-way integrations across the existing stack
  • Source-data lineage on every metric
  • Custom alerts and workflows in the brain
  • Audit trail across operations and asset performance

From operational activity to NOI

One operating system, one source of truth.

Mockup

Every interaction, every asset

Marketing and leasing pipeline, community feedback, resident engagement, asset performance — all live in one connected operating system. No reconciliation, no exports, no chasing the analyst who built the spreadsheet.

  • Portfolio overview at a glance — units, value, vacancy, tenancy length
  • MTD tracking against prior month, prior year, portfolio average
  • Twelve months of KPIs across marketing, leasing and community
Mockup

Signals and alerts when needed

Insights+ doesn't just report — it watches. Voids forming three weeks early. Declines spiking on a specific reason. Portals underperforming. Satisfaction dropping in one building. The team sees what to act on before the month ends.

  • Leasing funnel diagnostics with declined-reason trends
  • Demographic and pen-portrait insight by asset and geography
  • Community feedback, NPS and satisfaction, and ticket categorisation
Mockup

Turning signals into action

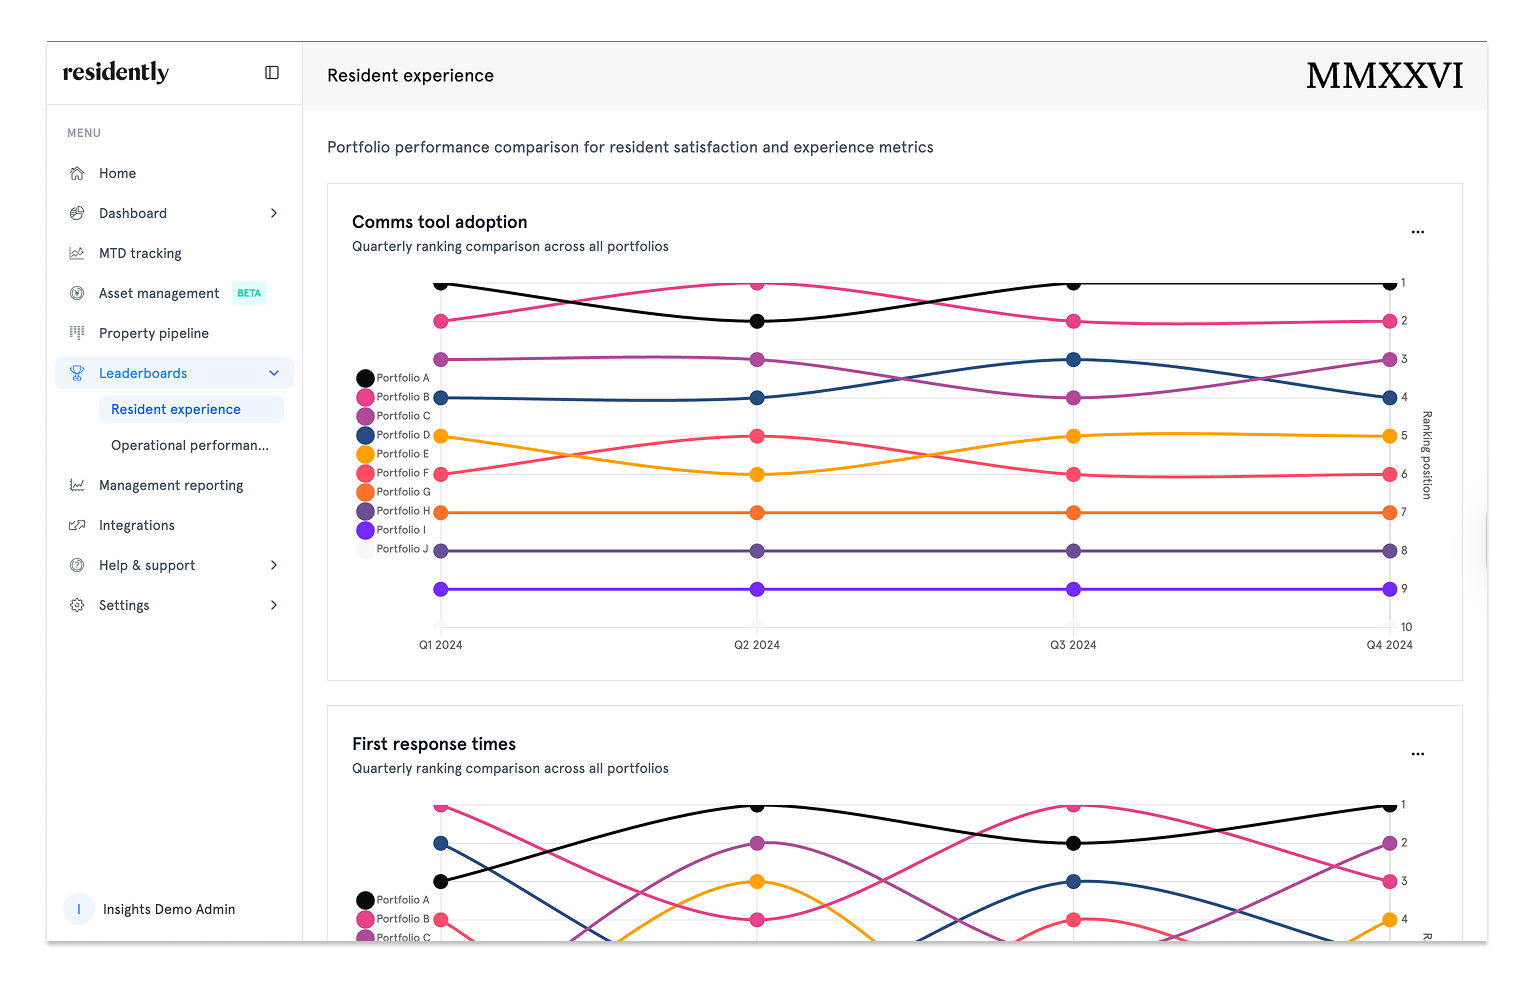
Custom alerts, tasks, workflows and leaderboards push the right thing to the right person at the right time. The dashboard visits the team — they don't have to visit it.

  • Custom alerts on the metrics that matter to your business
  • Resident-experience leaderboards across portfolios
  • Workflow automation for the moments that move NOI
Mockup

Numbers owners, LPs and IC will trust

NOI bridge, void cost waterfall, reversionary potential, Yield Control. The asset story your owner asks for every quarter — defensible, reproducible, real-time, and shaped before the variance, not after.

  • NOI bridge with variance attributed to drivers
  • Void cost waterfall — controllable vs uncontrollable
  • Yield Control with market benchmarking and rent uplift tracking

Everything, all in one place

Book a demo

Join our newsletter to stay up to date on features, releases and industry news.
By subscribing you agree to with our Privacy Policy and provide consent to receive updates from our company.
Done ✅
Oops! Something went wrong
© 2026 Residently. All rights reserved. \\ noco.agency